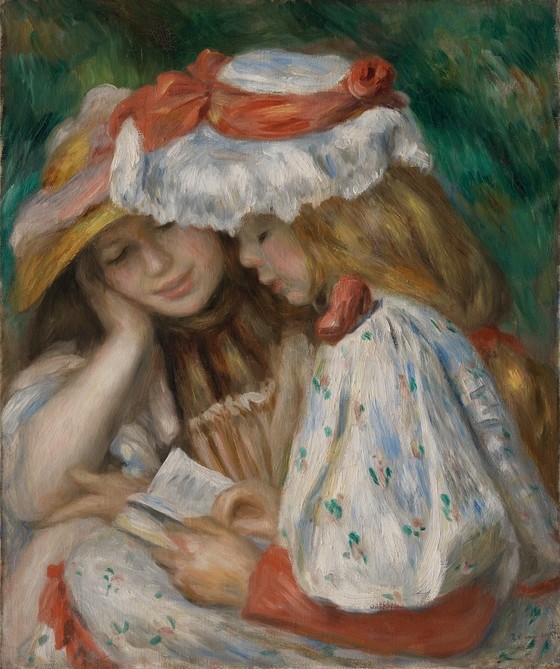
Okay, okay… “a picture is worth a thousand words.” Reading teachers know the relationship between words and pictures is a lot more complicated than that.
Research, for instance, has shown repeatedly that when you’re trying to teach kids to read a word, it is best to ditch the pictures. Word learning requires that attention be focused on the sequence of letters, not the accompanying photo or drawing. Those are just distractions.
Another problem with pictures and words is that when kids have trouble with some words in a text, they may try to depend on the picture context. The pictures may give the reader a way around the reading. Illustrations may even allow some kids to slip through the cracks, allowing them to answer comprehension questions without any grasp of the words.
Young kids often conclude that book-sharing parents or teachers are making the stories up from the pictures. They’re surprised to discover that while they were examining the art, the adult was reading the squiggles.
RELATED: What Do We Do With Above Grade Readers?
We seek ways to teach kids to ignore the pictures for the words.
Yep, pictures can be a problem for beginning readers. If things go well, students come to rely less and less on pictures.
What about informational texts, like science books? Now that’s a horse with an entirely different pigmentation.
With science texts this progression goes in the opposite direction. In the primary grades, science graphics are like what one finds in storybooks – illustrations there to motivate or to restate the words.
Science graphics don’t fade away. They get superseded by scientific graphics aimed at supplementing and extending the textual information rather than replacing it. (Glossy high school textbooks are sometimes an exception to this. Those graphics may be more about decoration than information – a complaint of both science and history teachers).
It is fair to say that for a lot of academic reading, graphics are of central importance. Students who can’t make sense of them are at a real reading comprehension disadvantage. Understanding content text requires a reliance on graphics, not to help with the comprehension of the words, but to provide readers with a complete understanding.
A scientist once explained to me that science works that way because it describes natural concepts, relationships, and processes and that language is ill fitting for this purpose. Consequently, scientists try to describe these things in multiple ways – in words, graphics, and mathematically. They are all imperfect representations, of course, but together they provide the most complete and accurate rendition of the information.
That only works if readers can make sense of words and graphics. My experiences with high school science students tells me they have no idea how to read graphics. If referred for reading help – they may have trouble with both words and graphics – the reading teacher focuses on the former alone (and the science teacher stops using the textbook altogether).
There are whole books written on this topic (Roth, Pozzer-Ardenghi, and Han, 2005) and there is more to teaching graphics reading than I can provide in a blog entry. But there should be enough room for me to offer some basic recommendations that may benefit your students. You might dismiss this, waving it away as not being your responsibility – reading teachers teach kids to read written words.
My response? Kids even need help making sense of the words in the graphics – the captions, labels, and such. Teaching students to read such graphics is our responsibility.
One thing students should know is that graphics tend to communicate five kinds of information: spatial relations, time sequences, relationships among variables, classifications and hierarchies, and causation.
1. Spatial graphics depict the spatial placement of objects or the physical relations among objects or parts. This may be accomplished with photos or scientific drawings. An understanding of spatial graphics is demonstrated by being able to describe or remember the placement of the items and their relationships and why that is important.

2. Sequential graphics represent the steps in a processes or cycles that take place over time. Flow charts are often used for this purpose. Understanding can be demonstrated by an ability to describe the steps in the appropriate sequence and key features of the process such as asymmetricity, circularity, etc.
.png)
3. Variable relationship graphics reveal similarities and differences in phenomena or processes or relationships among variables (such as correlation). These may be represented with tables, bar graphs, etc. Understanding these graphics requires that readers recognize what is being compared or connected and to draw appropriate generalizations about these relations.

4. Classification/Hierarchical graphics reveal taxonomic or rank relationships or arrangements among phenomena, objects, processes, etc. These may be represented with tree diagrams, category graphs, etc. Understanding these requires recognition of what is being compared or related and the nature of the relations (e.g., superior to inferior, general to specific, sources).

5. Causal graphics reveal conditions or actions that lead to outcomes. These come in many forms; be especially attentive to graphics that illustrate relationships between two variables (some may be correlational and others causal). Understanding requires being able to describe the antecedent, consequent, and how the former impacts the latter.

Teaching students to recognize the range of purposes of graphics and how they work will go a long way towards building greater reading comprehension. You’ll be amazed at the discussions that ensue and how much richer the rest of the reading can be.
References
Roth, W., Pozzer-Ardenghi, L., & Han, J. A. (2005). Critical graphicacy: Understanding visual representation practices in school science. Dordrecht, The Netherlands: Springer.
LISTEN TO MORE: Shanahan On Literacy Podcast
READ MORE: Shanahan on Literacy Blogs

.jpg)


Comments
See what others have to say about this topic.